Rendering a scatter plot with p5.js
After Rendering a scatter plot with Matplotlib, I had to add interactivity (or animation in this case) to the static Matplotlib plot.
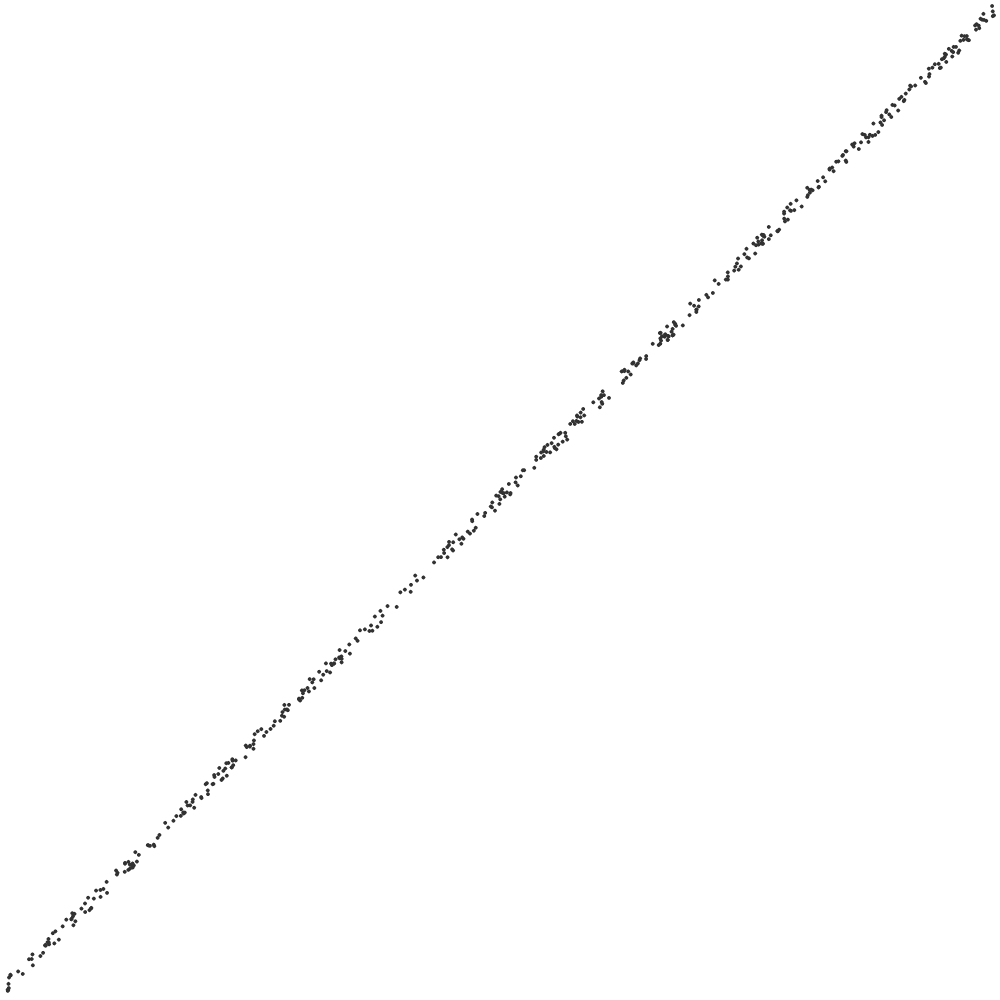
Here's how to generate linear-looking data1, visualize it with p5.js, and save it as a high-resolution PNG image. You can see this p5 sketch in action.
// https://editor.p5js.org/nonoesp/sketches/O1_9yJYqK

let amount = 500
let xPaddingPercent = .15
let yPaddingPercent = .15
let X, y, xSize, ySize, xScale, yScale, xPadding, yPadding, lambda

function generateData() {
  xSize = width - 2*xPadding
  ySize = height - 2*yPadding

  X = Array.from({length: amount}, () => Math.random() * xSize)
  y = Array.from({length: amount}, () => Math.random() * ySize)
  for (let i = 0; i < X.length; i++) {
    y[i] = 3 + lambda*lambda*X[i] + y[i]
  }

  xScale = xSize / Math.max(...X)
  yScale = ySize / Math.max(...y)
}

function setup() {
  canvas = createCanvas(500, 500);
  xPadding = xPaddingPercent * width
  yPadding = yPaddingPercent * height
  setAttributes('antialias', true);
  noStroke();
  fill(50);
}

function draw() {
  background(255);
  lambda = Math.cos(0.08*frameCount+2*Math.PI) * 4 + 4
  generateData()
  for(let i = 0;i <= X.length; i++) {
    circle(xScale*X[i]+xPadding, height - yScale*y[i] - yPadding, 2)
  }
}
Hands-On Machine Learning with Sci-Kit Learn, Keras, and TensorFlow: Concepts, Tools, and Techniques to Build Intelligent Systems. 2nd Edition. Aurélien Géron. O'Reilly. 2019. ↩